The Great Mental Models of Artificial Intelligence · Lecture Ten
Everything Is a Distribution
A machine that answers "the cat" is hiding something. Underneath, it never had one answer — it had a whole spread of possibilities, and it rolled the dice. Once you see that every model, in every field, is really a distribution in disguise, you stop thinking like a beginner and start thinking like an engineer.
Scroll slowly ↓
One · two ways to see the world
The single answer is a lie
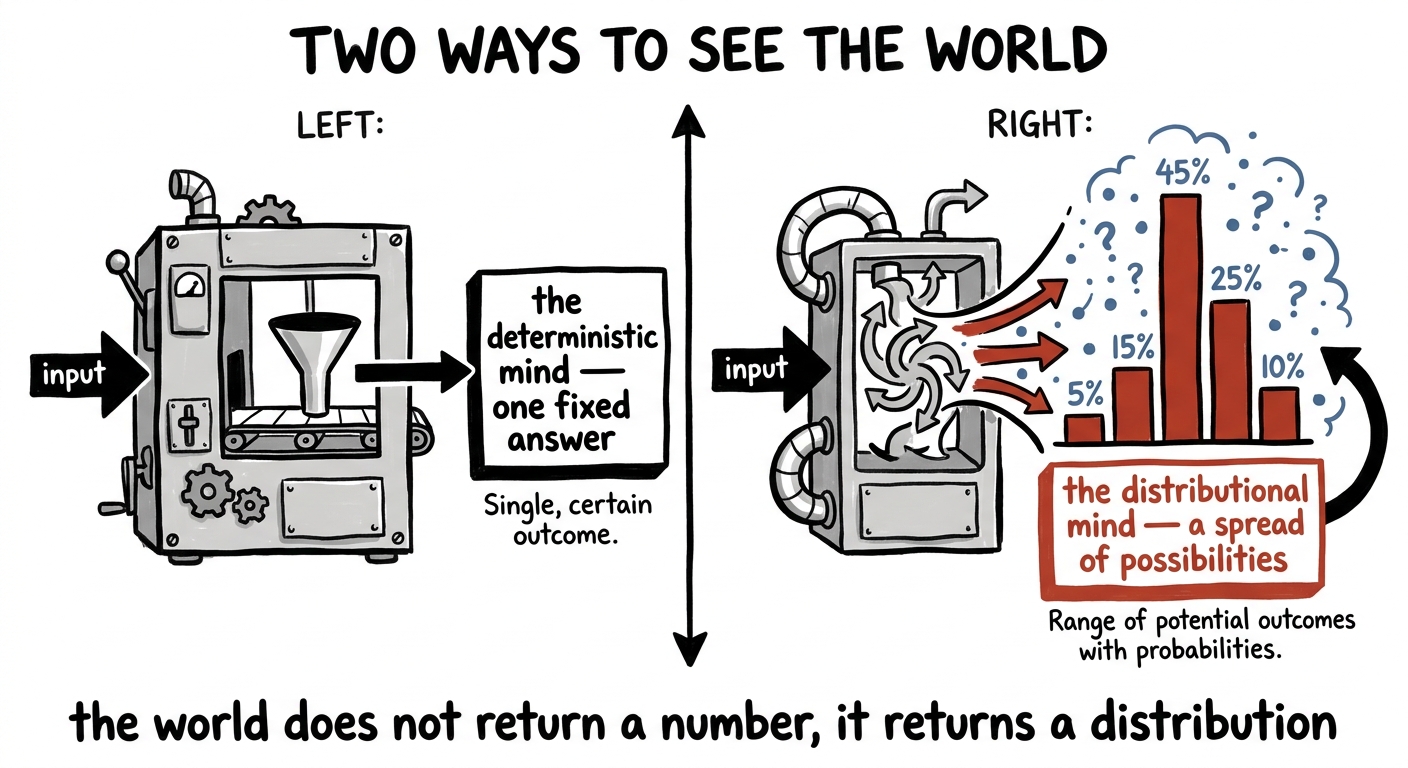
Ask a calculator for 7 × 8 and it returns 56. One input, one answer, forever. That is the deterministic picture of a machine, and it is the one most people carry in their heads: you put something in, a fixed answer comes out. It is a comforting picture. It is also, for almost everything interesting in artificial intelligence, wrong.
Ask a language model to finish "the cat sat on the ___" and something very different is happening under the hood. The model does not decide, deep down, that the word is "mat." It builds a whole landscape of possibilities — mat 41%, floor 12%, roof 6%, windowsill 3%, and a long tail of thousands of rarer words — and then it picks one by weighted chance. Run it again and you might get "floor." The single word you see on your screen is the last step of a process that was, at its heart, a spread. A distribution.
figure generating…
This lecture is a single, load-bearing idea, and I want to say it plainly before we earn it: almost nothing in modern AI outputs an answer. It outputs a distribution over answers, and then samples. Generation, classification, regression, reinforcement learning, a model's confidence, its creativity, its hallucinations — all of them are the same shape wearing different clothes. Learn to see the distribution behind the answer and a hundred confusing behaviours snap into one.
Two · from first principles
What a distribution actually is
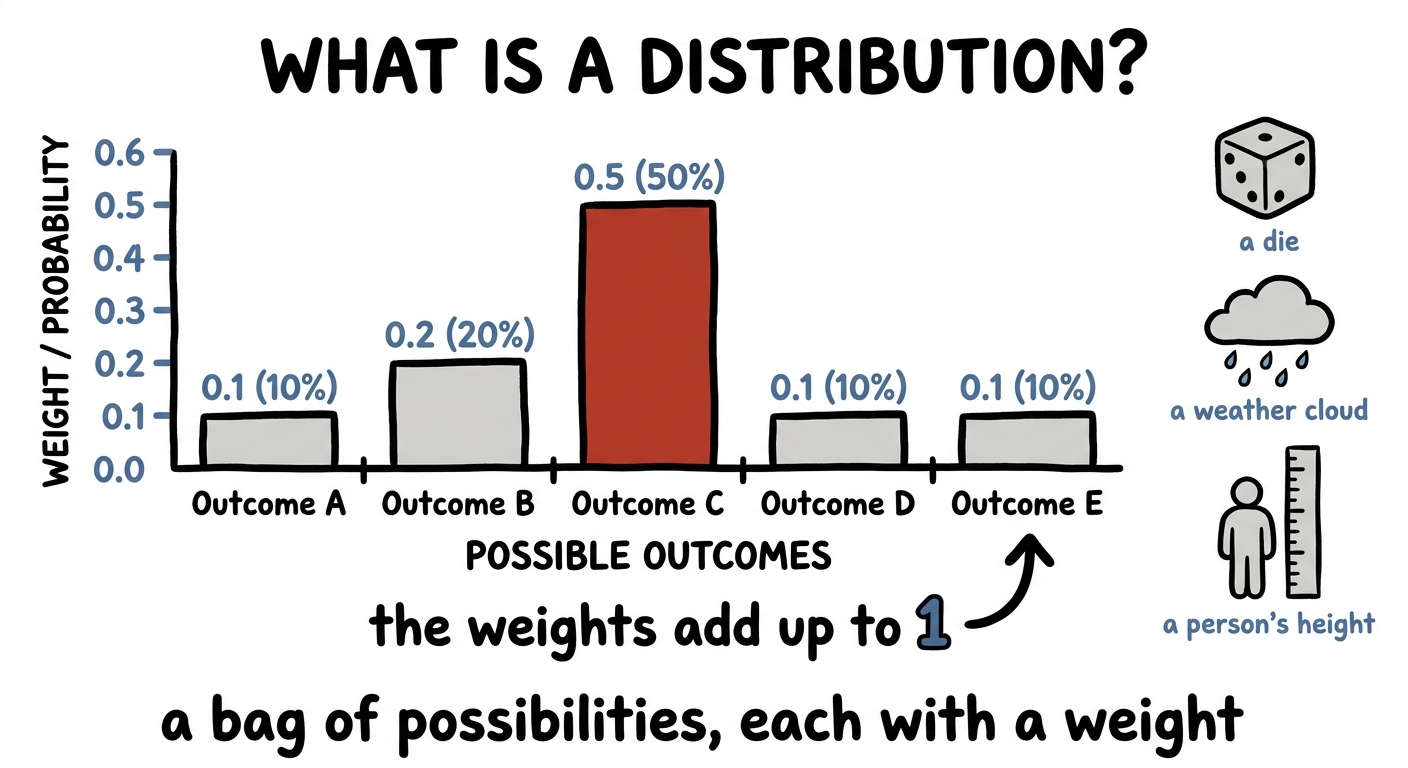
Forget the equations for a moment. A distribution is the simplest honest thing in the world: it is a bag of possibilities, each with a weight. That's it. List everything that could happen, and next to each one write how much of your belief it gets. The only rule is that the weights add up to one whole — you have exactly one unit of belief to spread around, and you must spend all of it.
A fair die is a distribution: six faces, each carrying 1/6 of the belief. Tomorrow's weather is a distribution: sunny 60%, cloudy 30%, rain 10%. The height of the next person to walk through the door is a distribution — a smooth bell centred near average height, thinning out toward the very short and the very tall. A single number, like "the average human is 1.7 m tall," is just the distribution's centre of gravity. The number is a summary. The distribution is the truth.
figure generating…
Hold on to the shape of the thing, because it will not change for the rest of the lecture. Whenever you meet a model and wonder what it is really doing, ask one question: what are the possibilities, and what weight does it put on each? Answer that and you have found the distribution hiding inside it.
Three · the first great example
To generate is to sample
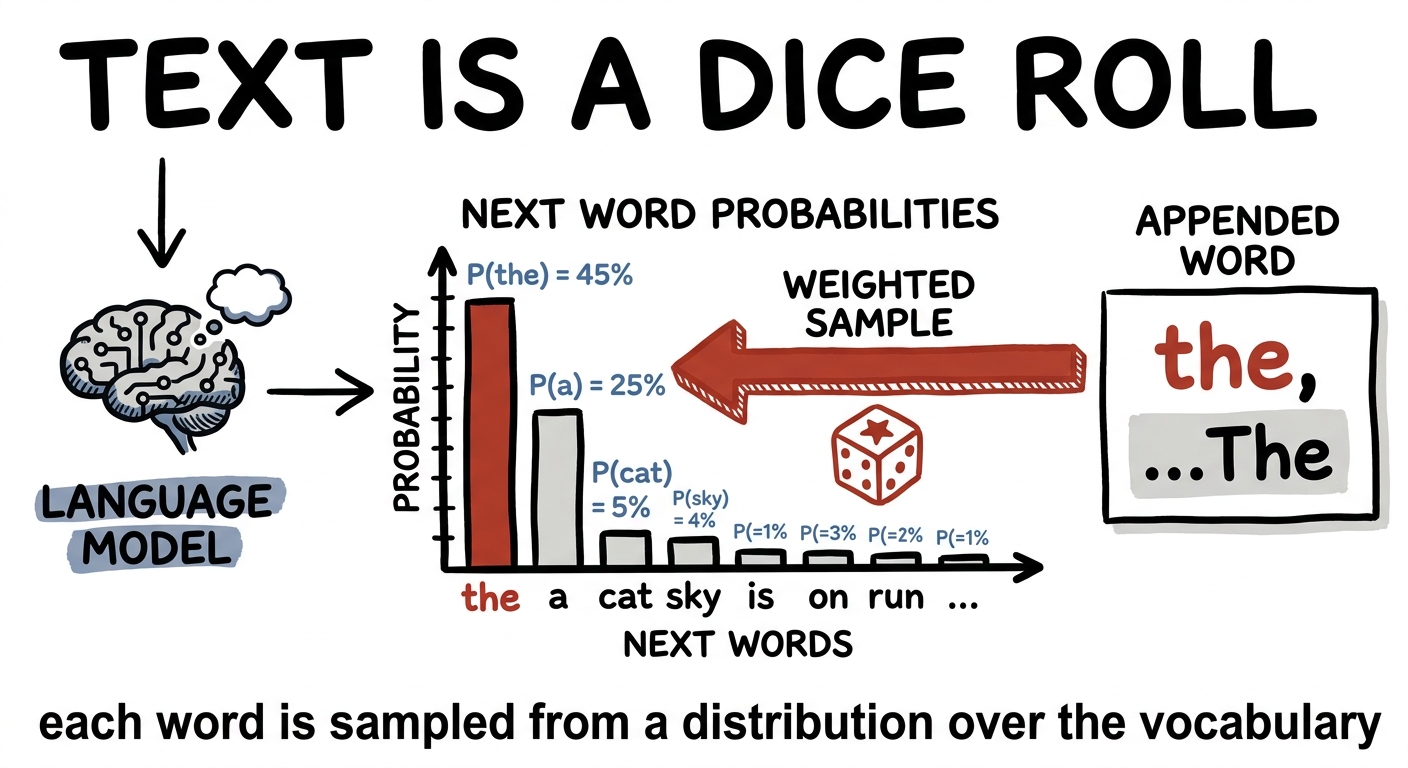
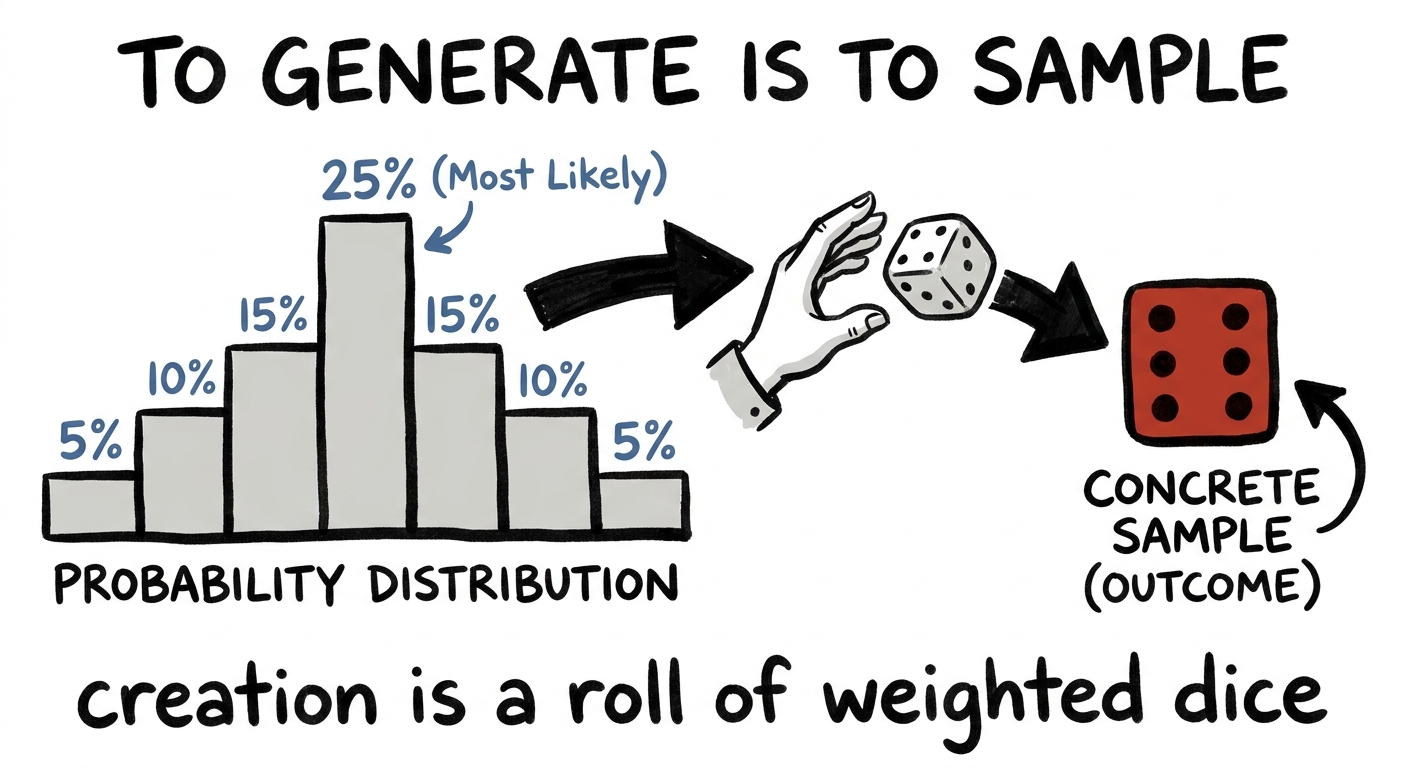
Here is the sentence that reframes all of generative AI. Generating something is drawing one sample from a distribution. Nothing more mystical than rolling a weighted die. The magic is not in the roll — the roll is trivial. The magic is that a neural network learned which way to weight the die.
Think about what your phone's autocomplete does, then scale it up. A language model reads everything so far and produces a distribution over the next word — thousands of little weights. To write, it rolls that weighted die, gets a word, appends it, and does the whole thing again for the next word. A paragraph is not composed; it is sampled, one weighted roll at a time. That is why the same prompt gives you different essays: you are drawing fresh samples from the same distribution, like dealing new hands from the same deck.
figure generating…
figure generating…
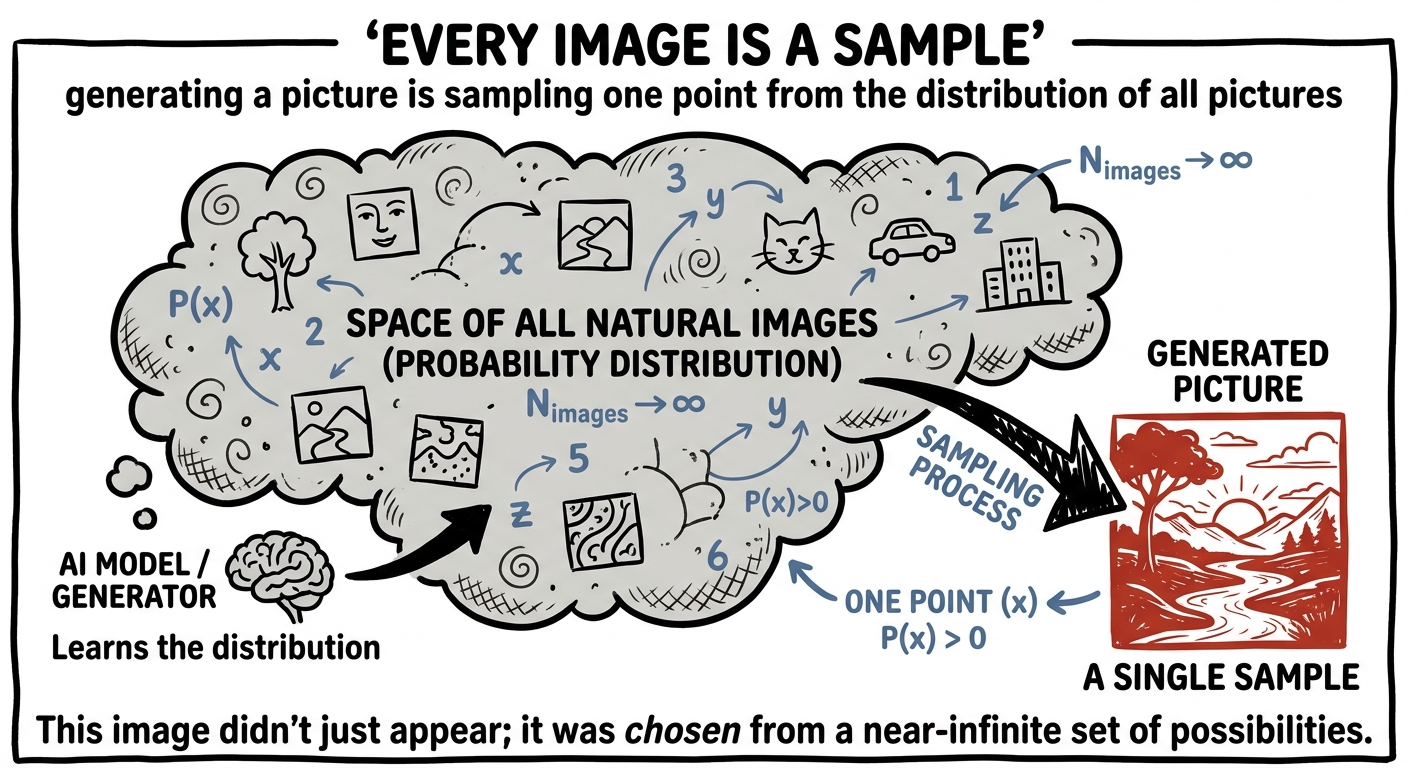
Images are the same story told with pixels instead of words. When Midjourney or Stable Diffusion paints a picture, there is no single "correct" image waiting to be revealed. There is an unimaginably vast distribution over all the pictures that could plausibly match your prompt, and the model draws one point out of that ocean. Ask for "a red bicycle" a thousand times and you get a thousand different red bicycles — a thousand samples from one distribution. Every image a generative model has ever made is a dice roll.
figure generating…
Four · how scores become chances
Softmax: the machine that makes distributions
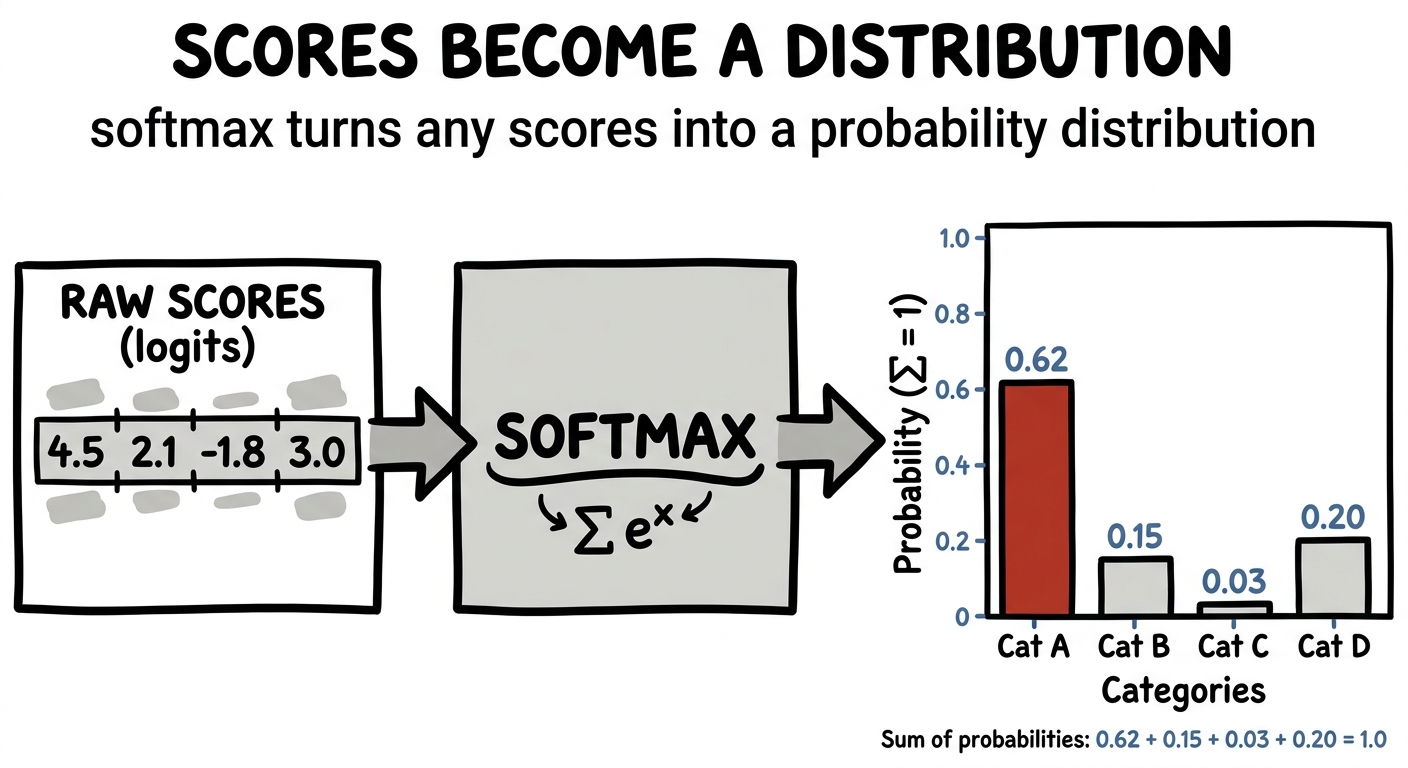
So a model needs a distribution over the next word. But a neural network doesn't naturally speak in probabilities — it speaks in raw scores, one number per word, called logits. A word the model likes gets a big score; a word it dislikes gets a small or negative one. These scores are not a distribution: they don't add to one, and some are negative. We need a machine that turns any list of scores into a clean set of weights. That machine is softmax, and it is everywhere.
Softmax does two simple things. First it makes every score positive by raising e to its power — big scores become hugely bigger, small ones shrink toward zero. Then it divides each by the total so they sum to one. Out the other side comes an honest distribution: every word gets a weight, the weights add to a whole, and the word the model liked most gets the biggest slice.
pi = e(scorei / T) ⁄ Σ e(score / T)
figure generating…
Notice the little T in there — the temperature from the last lecture. It is the one knob that reshapes the distribution before you sample. Turn it down and the biggest score runs away with almost all the weight: the die becomes loaded, the model says the safe, obvious word every time. Turn it up and the weights flatten out: the die becomes fairer, the model reaches for rare, surprising words. Below, watch it happen — and then actually sample. Each roll drops a real token according to the weights; the tallies build up, and the more you roll, the more the counts come to match the bars. Sampling is generation.
the sampling machine — set the weights, then roll
T = 0.3 · loadedT = 2.0 · fair
temperature T = 1.00 · rolls: 0 · last drawn: —
Two things are worth feeling in your hands here. First: at low temperature you draw the same word over and over — the distribution is peaked, so the sample is boringly predictable. At high temperature every word gets its turn — the distribution is flat, so the samples scatter. "Creative" and "unreliable" are the same fact seen from two moods. Second, and deeper: after enough rolls, the tally under each word climbs to match the height of its bar. That is what a distribution promises — not what happens once, but what happens in the long run.
Five · the example you didn't expect
Classification is a distribution too
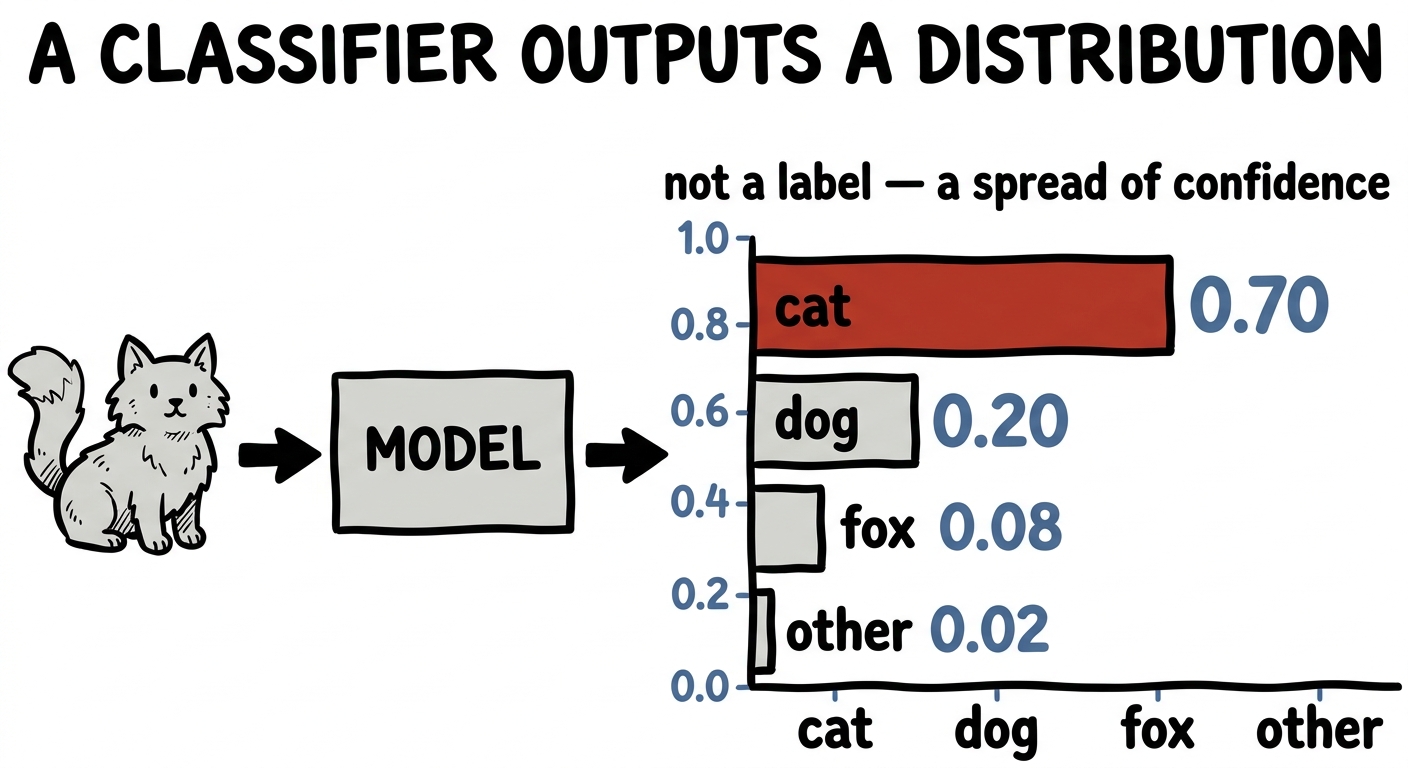
Now watch the idea reach somewhere it doesn't obviously belong. You think of an image classifier as a machine that says "cat." It is not. Look at what actually comes out of the final layer: a softmax — the very same machine — producing a distribution over the classes. Cat 70%, dog 20%, fox 8%, everything else 2%. The word "cat" you see printed is just the tallest bar with its label read aloud. The model's real answer was the whole bar chart.
figure generating…
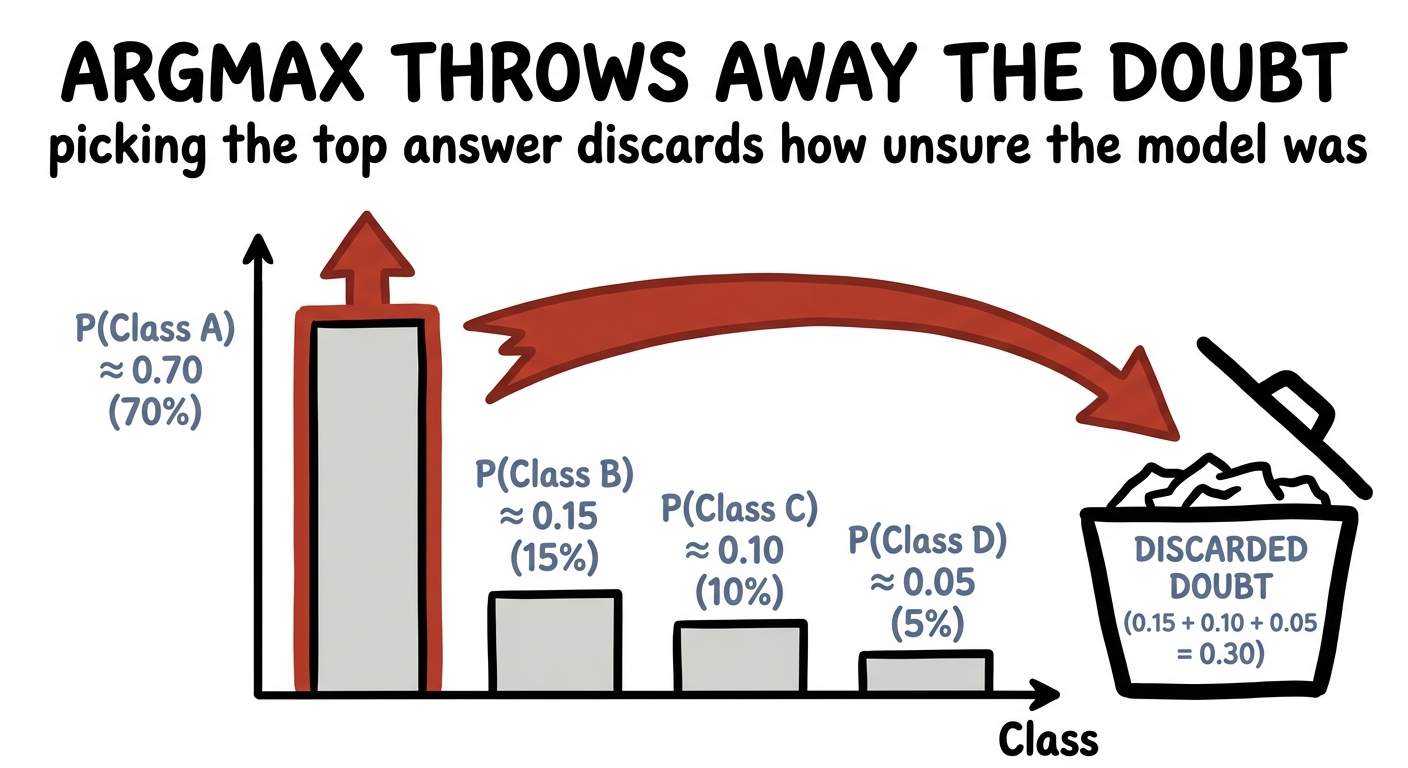
This is not a technicality — it is the most useful thing the model knows, and beginners throw it away. Taking only the top label is called argmax, and it discards every ounce of the model's doubt. "Cat 70%, dog 20%" and "cat 99%, dog 0.3%" both print "cat," but they are worlds apart: one is a shrug, the other is a certainty. A self-driving car that treats "pedestrian 55%, plastic bag 45%" as a confident "plastic bag" has thrown away exactly the information that would have saved a life. The distribution held the caution. Argmax deleted it.
figure generating…
the same three lines, everywhere
Scores go in, softmax turns them into a distribution, you read or sample from it. That is the ending of a language model, an image classifier, a spam filter, a move-picker in a game engine, and the action-chooser of a robot. Once you recognise the shape, half of deep learning stops looking like separate inventions and starts looking like one idea reused.
Six · the hardest case, cracked
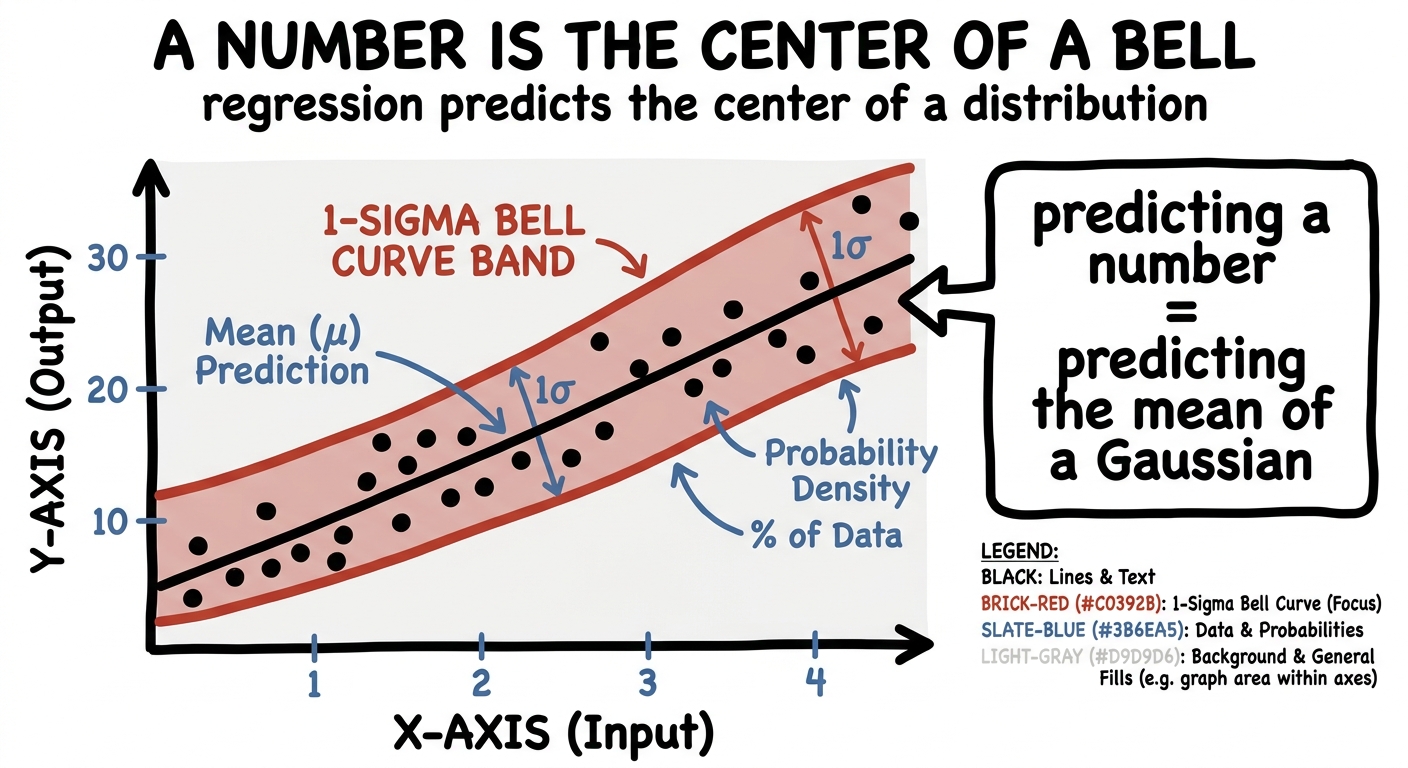
Even a plain number is a bell curve
Classification was already a distribution — softmax handed it to us. But surely regression, predicting a single continuous number, is the one honest place where a model just outputs one value? You ask for the price of a house and it says $500,000. One number. Where is the distribution?
It was there the whole time; we just never looked. When a model predicts "$500,000," what it is really claiming is: the price is most likely around 500k, and less and less likely as you move away from it in either direction. That sentence describes a bell curve — a Gaussian — centred on 500k. The model isn't predicting a point. It is predicting the centre of a bell, and quietly assuming a spread on either side. The number you read is just the peak.
figure generating…
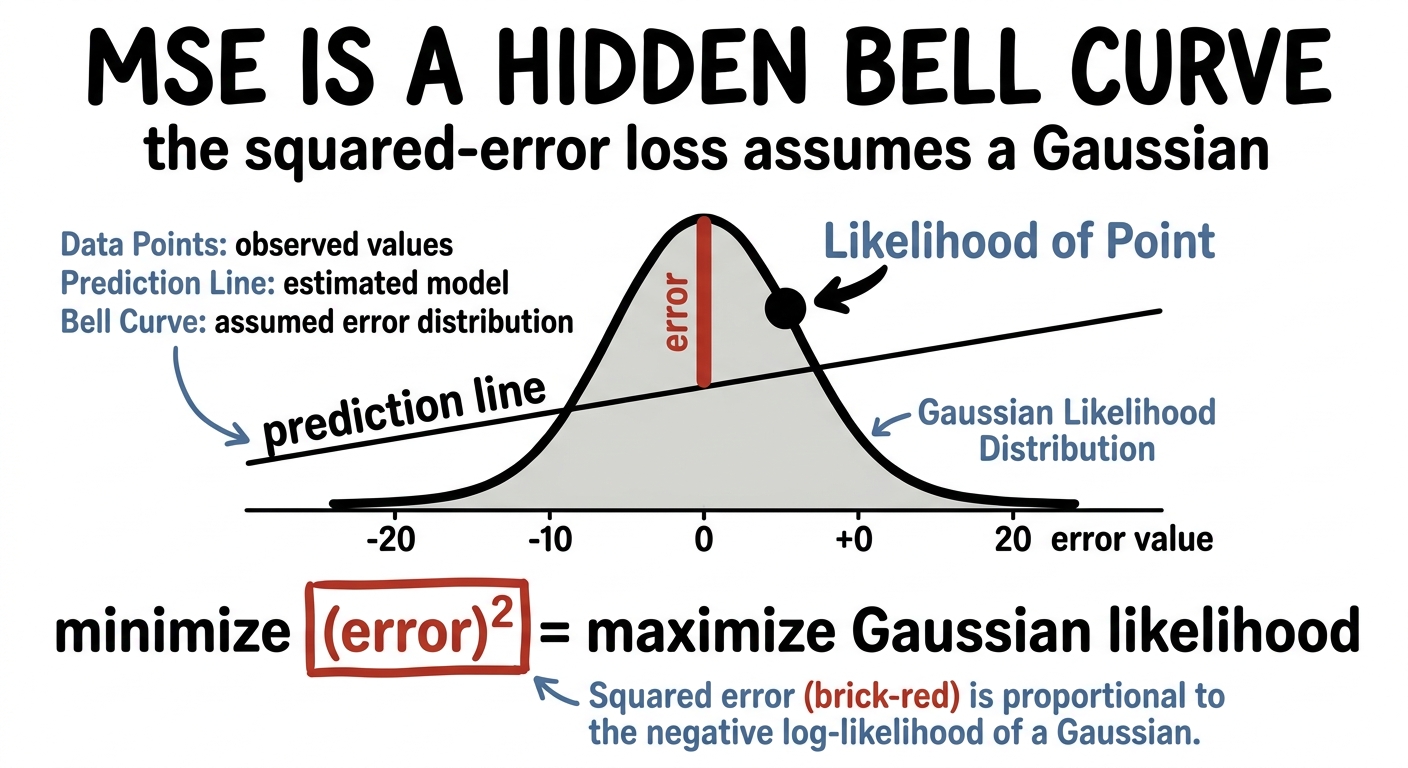
And here is the part that turns a nice picture into a genuine "oh." Every regression you have ever trained used mean squared error — punish the square of the gap between prediction and truth. That loss did not fall from the sky. If you assume the data is a bell curve around the model's prediction and then ask "what makes my data most likely?", the maths hands you back, exactly, minimise the squared error. MSE is not an arbitrary choice. It is what "fit a Gaussian" looks like when you write it down. The distribution was hiding inside your loss function the whole time.
figure generating…
Once you see it, you can do something you couldn't before: let the model predict the width of the bell too, not just its centre. Now it can tell you "$500k, and I'm very sure" (a narrow bell) or "$500k, but honestly it could be anything from 300 to 700" (a wide one). Drag below — a narrow bell hugs its guess tightly; a wide bell admits it's unsure. Same centre, completely different honesty.
regression is a bell curve — set how sure the model is
σ small · sureσ large · unsure
prediction = $500k · spread σ = ±60k · confident
Seven · honesty, for free
The shape is the model's honesty
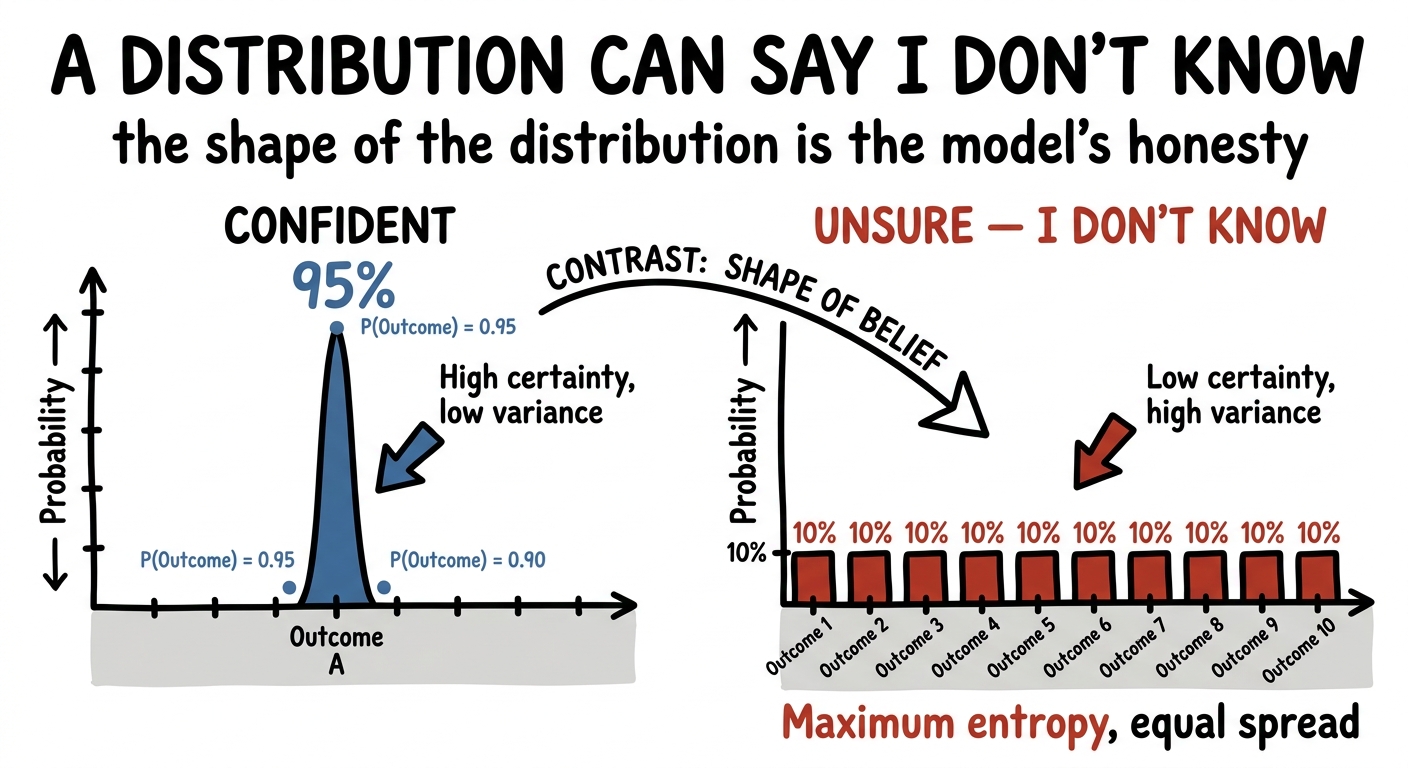
Notice what we just unlocked twice — once in classification, once in regression. Because the output is a distribution and not a bare answer, the model can tell you how sure it is at no extra cost. A tall, narrow spike means "I'm confident." A low, flat spread means "I really don't know." The confidence was never a separate feature bolted on. It is just the shape of the distribution, read off directly. This is the same idea as Lecture Nine's entropy — a flat distribution is high-entropy, a spiked one is low-entropy — which is why entropy and distribution are two halves of one lecture.
figure generating…
There is a discipline to earning that honesty, and it has a name: calibration. A well-calibrated model is one whose 70% actually means 70% — of all the times it says "cat, 70%," it is right roughly seventy times in a hundred. A model can be accurate and still lie about its confidence, and a model that knows when it doesn't know is worth far more than one that is always loudly certain. All of it — the trust, the caution, the graceful "I'm not sure" — comes from taking the distribution seriously instead of collapsing it to a single answer with argmax.
Eight · the idea keeps spreading
Acting, believing, and the whole world
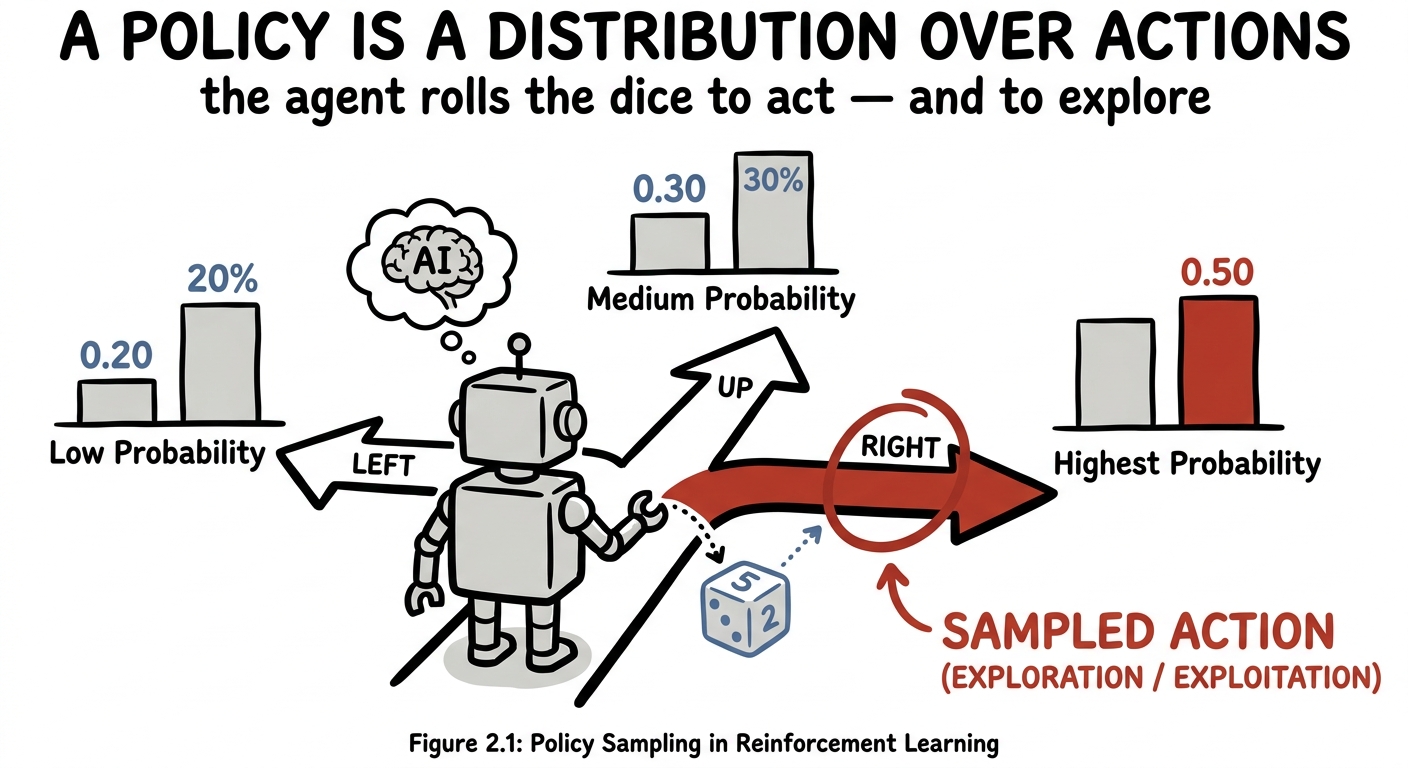
Step outside language and vision and the same shape is waiting. In reinforcement learning, an agent facing a choice doesn't compute the one right move — it holds a policy, a distribution over possible actions, and samples from it. That sampling is not a flaw; it is how the agent explores. Always take the action you currently think is best and you never discover the better one you haven't tried. The distribution over actions is what lets a robot gamble, stumble onto something new, and learn. Determinism can't explore. Only a distribution can.
figure generating…
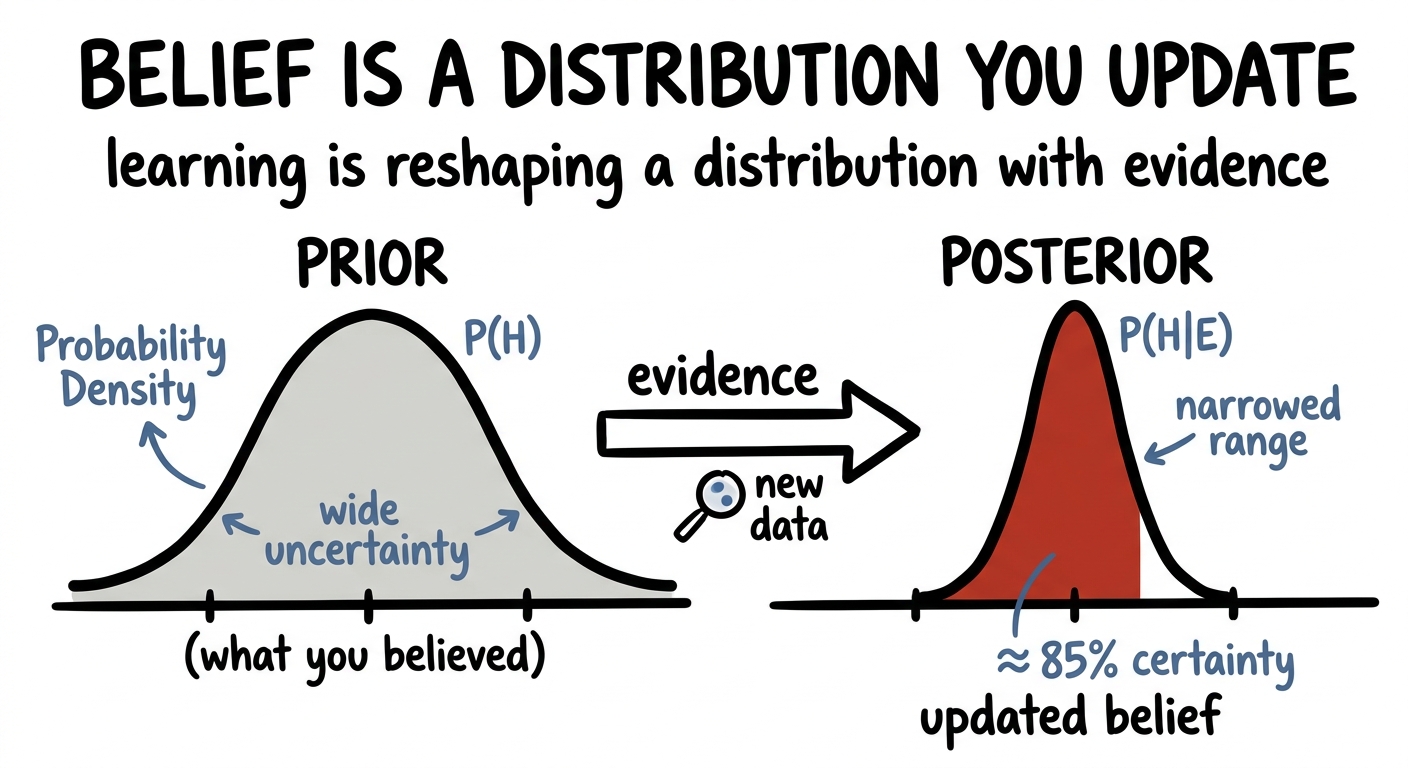
Go one level deeper and you reach the oldest version of this idea: Bayesian thinking. Here your own knowledge is a distribution. Before you see evidence you hold a prior — a wide, unsure spread. Evidence arrives and reshapes it into a posterior — usually narrower, shifted toward what you just learned. Learning itself, stripped to its bones, is nothing but taking a distribution over beliefs and updating it as the world speaks. A model's training is one long Bayesian update; so is a scientist's career; so is yours.
figure generating…
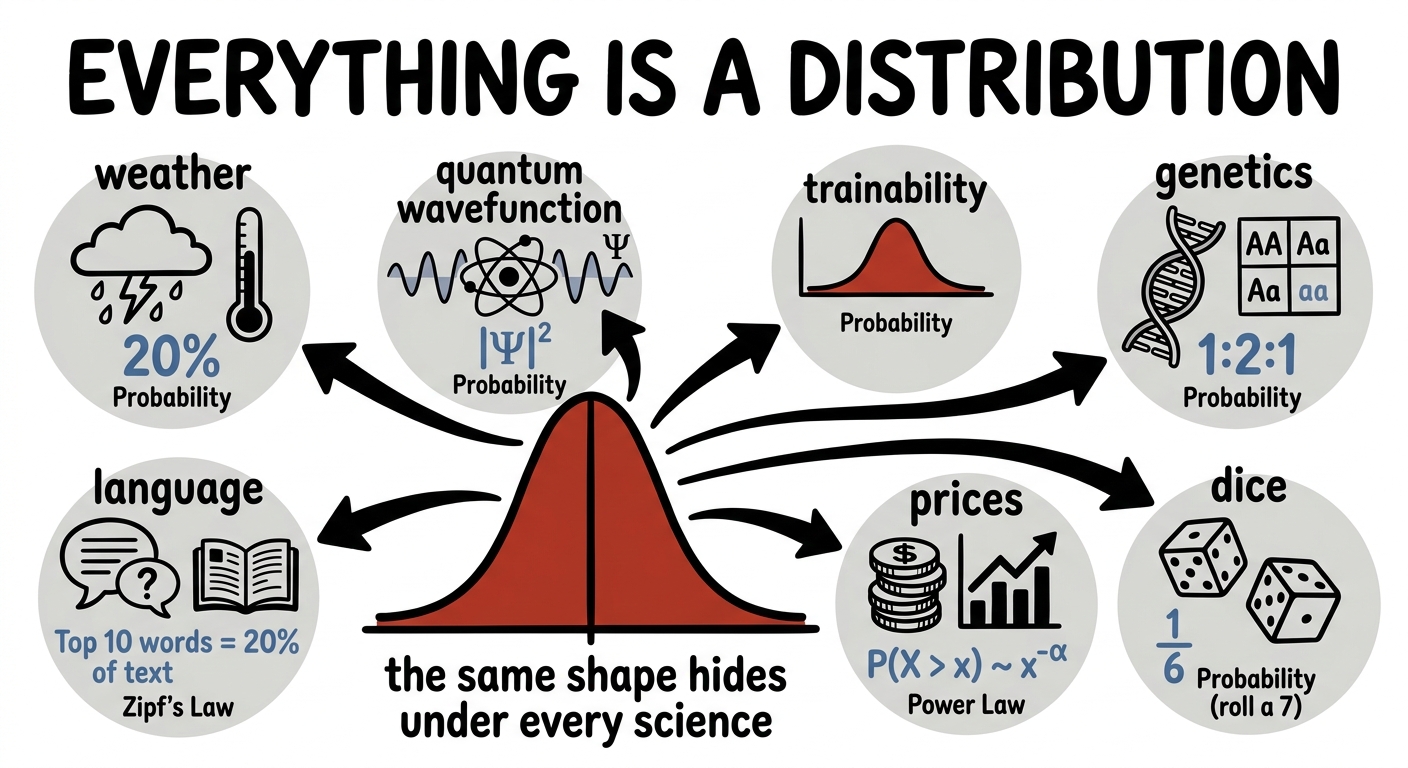
And it does not stop at machines. The weather report is a distribution. A quantum particle has no position until you measure it — only a distribution of where it might be, which is the deepest and strangest example of all. Genetics deals a distribution of traits; markets price a distribution of futures; a dice game is a distribution you can hold in your hand. The reason probability feels like the native language of so many sciences at once is that they are all describing the same thing: a world that does not hand you answers, only spreads over possibilities.
figure generating…
the callback worth making
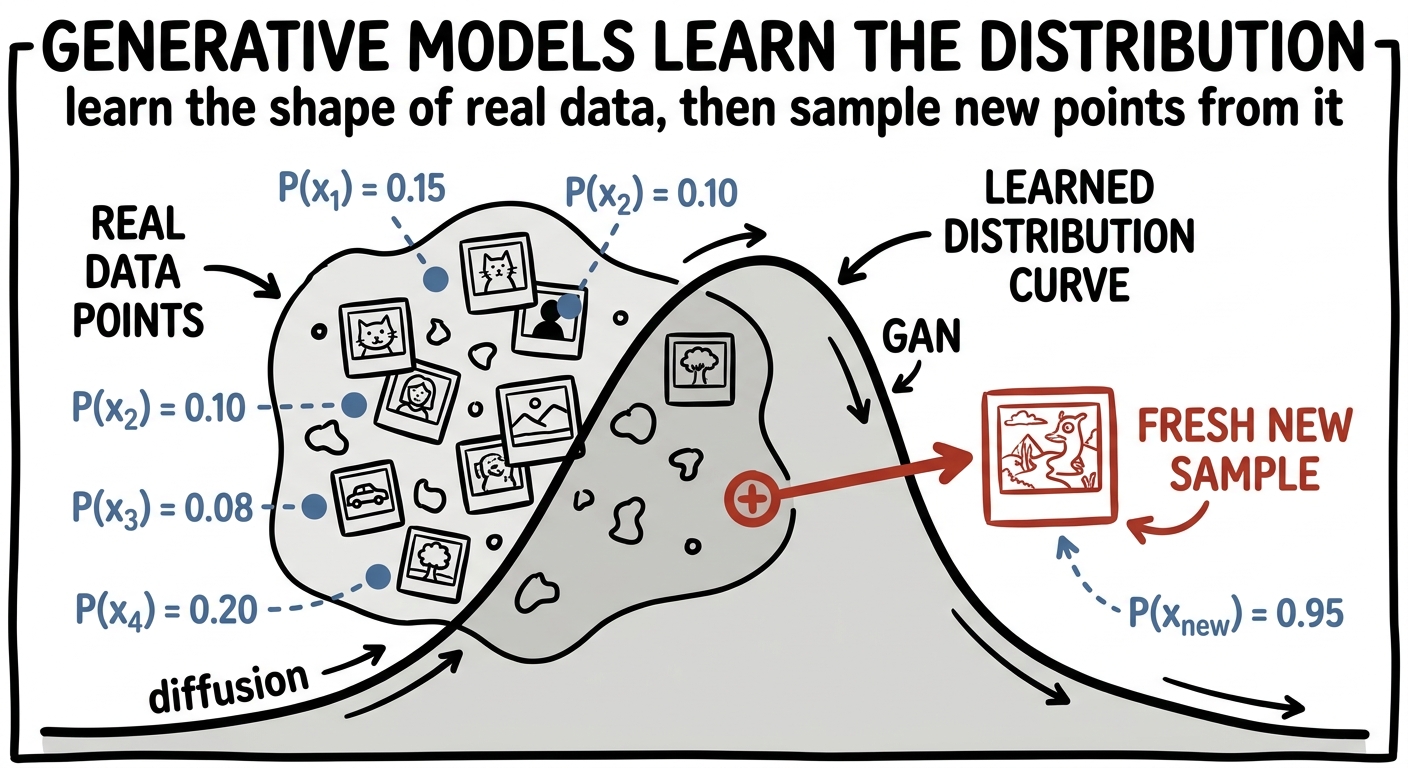
Every generative model in this series is, underneath, one sentence: learn the distribution of real data, then sample new points from it. Diffusion (Lecture Seven) learns it by reversing noise; adversarial nets (Lecture Eight) learn it by being caught faking; a language model learns it word by word. Different machinery, identical mission — capture the shape of what's real, then draw fresh samples that belong to it.
figure generating…
Nine · the move to keep
Think in distributions, not points
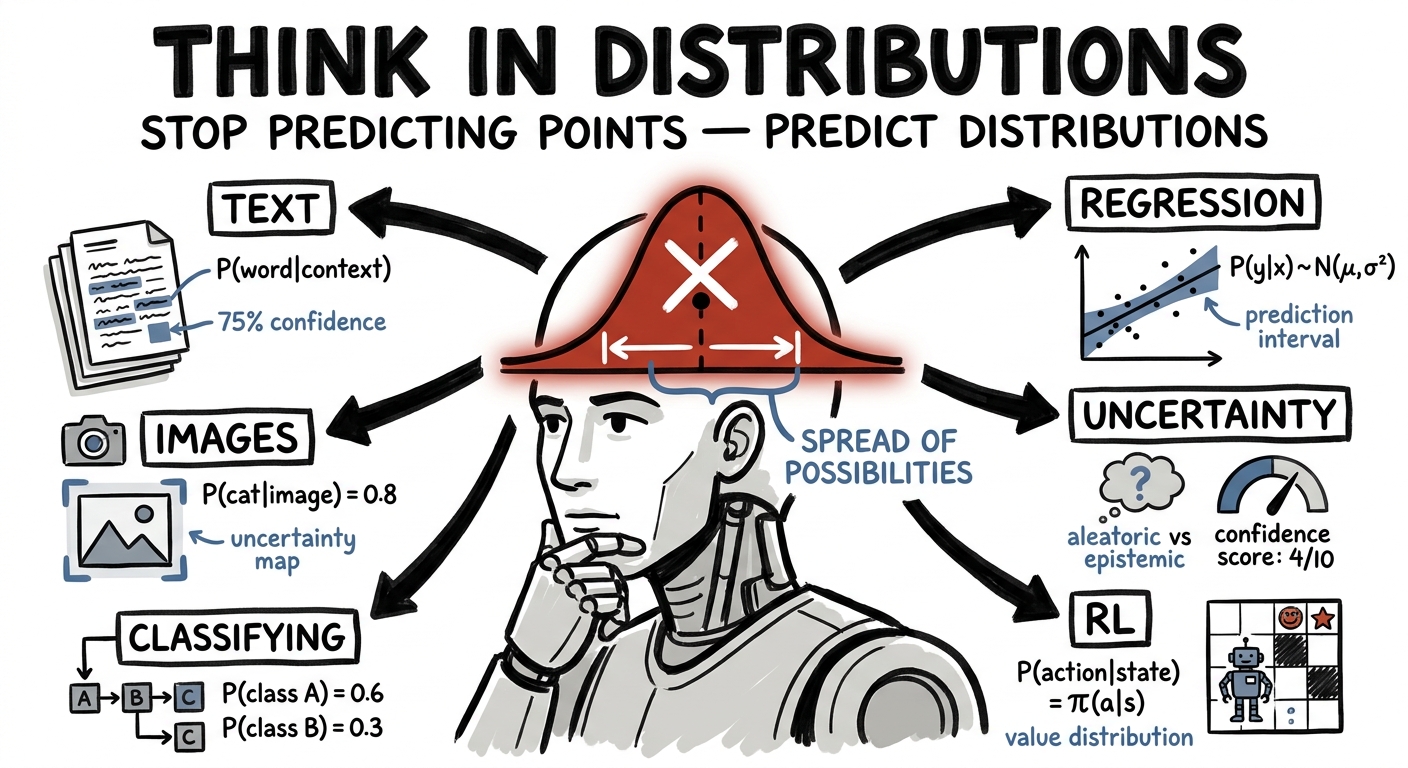
Here is the whole lecture folded into one habit of mind. The weak engineer sees a model as a machine that returns an answer, and is forever surprised — surprised that it gave a different reply the second time, surprised that it was confidently wrong, surprised that turning up "temperature" made it wild. The strong engineer sees the distribution behind every answer, and none of it is surprising. Different reply? You sampled again. Confidently wrong? The distribution was peaked in the wrong place. Wild output? You flattened the distribution before sampling. One picture explains all three.
figure generating…
So make it a reflex. When a model does something you don't understand, don't ask "what answer did it give?" Ask "what distribution is it sampling from, and why is it shaped that way?" When you build, don't collapse to a single number the moment you can — carry the spread as far as you can afford to, because the spread is where the confidence, the caution, and the honesty live. Deterministic thinking is a comfortable cage. Distributional thinking is the door out, and every strong AI engineer walks through it.
the move to keep
Almost nothing in AI outputs an answer — it outputs a distribution over answers and then samples. Generation is sampling. Classification is a distribution. Regression is the centre of a bell. Confidence is the distribution's shape. Learning is reshaping a distribution with evidence. Stop predicting points. Predict distributions, and the whole field lines up behind a single idea.